
What the Ghidra decompiler does—and what it does not do
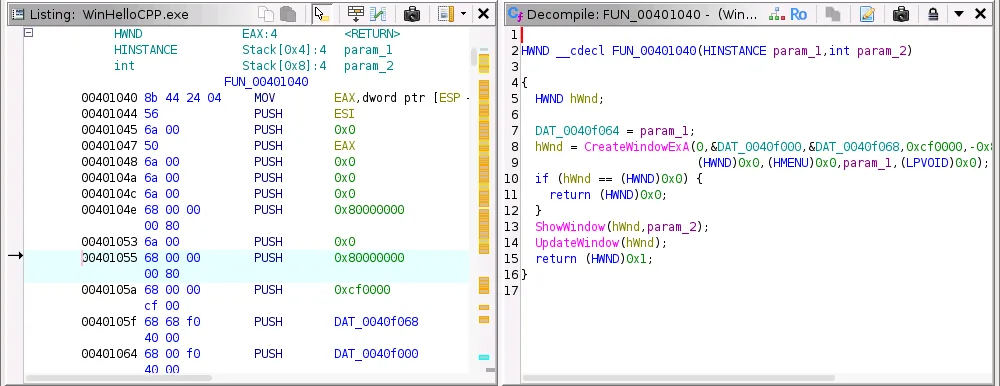
Ghidra analyzes instructions, control flow, calling conventions, symbols, and data types, then expresses one function as readable C-like pseudocode. The Decompiler is especially useful for spotting decision branches, repeated loops, argument use, return values, and relationships between callers and callees.
The output is not the program's original C or C++ source. Compiler optimizations remove names, merge expressions, reorder work, inline functions, and erase high-level types. Treat every variable name, type, and expression as a working hypothesis. A sound conclusion should still make sense when you compare the same addresses in Listing and inspect the surrounding references.
This focused page covers the Decompiler itself. If you still need to create a project, import a file, run Auto Analysis, and learn CodeBrowser navigation, start with the Ghidra tutorial for beginners.
Use pseudocode as a readable map of machine-code behavior, not as proof of the original source.
Open the Decompiler and synchronize it with Listing
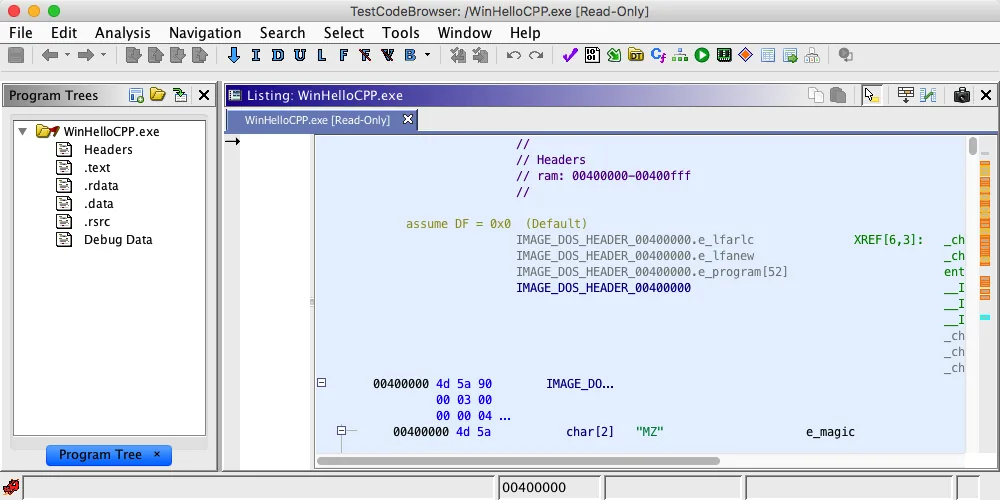
Open a program in CodeBrowser after Auto Analysis finishes. If the Decompiler window is hidden, choose Window > Decompiler. Select a defined function in Listing or Symbol Tree; the Decompiler should update to that function and highlight the corresponding statement when you move through instructions.
Start from a reliable anchor instead of scrolling randomly. A unique string, imported API call, exported symbol, error message, or known entry point can lead to a useful function. Follow references to the caller, select it, and wait for the status indicator to finish before judging the result.
If the window says there is no function, define the function only when the disassembly and references support that boundary. If the processor language or image base is wrong, correct the import first; cosmetic renaming cannot repair incorrectly decoded instructions.
- 1
Choose an anchor
Find a string, symbol, import, or address tied to the behavior you want to explain.
- 2
Follow the reference
Open the referencing function and confirm that Listing, Symbol Tree, and Decompiler point to the same location.
- 3
Let analysis settle
Wait for background analysis and decompilation to finish, then read the function from inputs to return value.
How to read Ghidra pseudocode without overtrusting it
Read the signature first: return type, parameters, and calling convention shape the whole function. Generic names such as param_1, local_18, FUN_00401230, and undefined8 mean Ghidra lacks evidence, not that the program used those identifiers. Trace where each value comes from, how it changes, and where it is consumed.
Then identify conditions, loops, calls, memory access, and the return path. Double-click a called function to descend, use navigation history to return, and inspect references before assuming a call's purpose. Hover and cross-highlighting help connect one pseudocode expression to its exact instruction range.
Compiler output can make a simple source expression look complicated, or make several low-level operations look deceptively clean. When a conclusion matters, confirm branch direction, constants, signedness, pointer arithmetic, and side effects in Listing.
| Decompiler clue | Likely meaning | What to verify |
|---|---|---|
| param_1 / local_10 | Unknown parameter or local | Uses, stack offset, callers |
| FUN_... | Unnamed function | Callers, strings, imports, behavior |
| undefined4 / undefined8 | Size known, type uncertain | Registers, casts, memory layout |
| goto / unusual loop | Recovered control flow | Branch targets and Function Graph |
| extra casts | Type disagreement or optimization | Signedness, pointer type, prototype |
Improve decompiler output with names, signatures, and data types
Decompiler quality improves when your project contains better facts. Rename a function only after its role is supported by calls, strings, imports, or data flow. Rename variables by responsibility rather than by guessed business meaning, and add comments that explain evidence or uncertainty instead of restating the pseudocode.
Correct function signatures are high leverage. A wrong return type or parameter list spreads misleading casts and pointer arithmetic through every caller. Apply structures, enums, arrays, and pointer types when repeated offsets and accesses support them. Re-run analysis or re-decompile after meaningful type changes and review affected callers.
Make one evidence-backed change at a time. This preserves a reviewable trail and makes it easier to undo an attractive but unsupported assumption.
- 1
Rename stable symbols
Use descriptive partial names such as parse_header or check_length only when visible evidence supports the role.
- 2
Fix the prototype
Correct return value, parameters, calling convention, and pointer depth before polishing local variables.
- 3
Apply reusable types
Create structures and enums when the same offsets or constants recur across functions.
- 4
Review callers
Check whether the refined signature makes neighboring functions clearer without introducing contradictions.
Verify decompiler conclusions in Listing and Function Graph
Listing is the address-level record of decoded instructions and data. Use it to confirm which comparison controls a branch, whether a value is signed or unsigned, where a call returns, and whether a memory write happens before or after a check. Cross-highlighting between Listing and Decompiler makes this comparison practical.
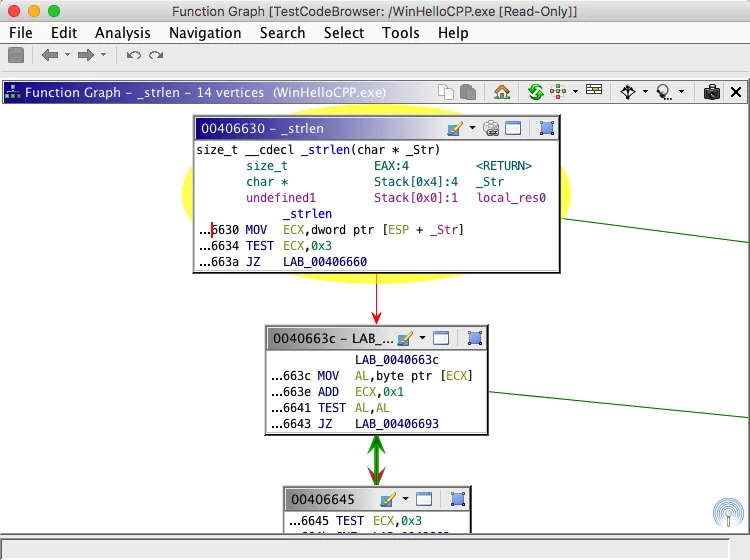
Function Graph is useful when nested conditions, early returns, or loops are hard to see in linear pseudocode. Follow the true and false edges, identify blocks shared by several paths, and then return to the Decompiler to write a concise explanation of the behavior.
For important findings, record the function address, decisive instruction or block, relevant references, and your confidence. That note remains useful even when later type information changes the pseudocode presentation.
Why Ghidra decompilation looks wrong or incomplete
Poor output is often a symptom of missing or incorrect analysis facts. Check the import language, compiler specification, memory map, image base, function boundary, signature, and analyzer results before assuming the Decompiler itself has failed.
Obfuscation, packed code, hand-written assembly, indirect calls, exceptions, aggressive optimization, self-modifying behavior, and unsupported processor features can limit recovery. In those cases, narrow the question: verify one branch, one data structure, or one caller instead of expecting clean source-like output for the entire program.
| Symptom | Likely cause | Next check |
|---|---|---|
| No function | Boundary not defined | References and disassembly |
| Nonsense instructions | Wrong language or base | Import settings and memory map |
| Too many casts | Bad signature or types | Prototype, signedness, pointer depth |
| Missing calls | Indirect flow or analysis gap | XRefs, call sites, analyzers |
| Very complex pseudocode | Optimization or obfuscation | Smaller slices and Function Graph |
A repeatable 20-minute decompiler practice workflow
Use a small program you own, an open-source binary, a capture-the-flag sample, or another file you are authorized to inspect. Import it in an isolated lab, run Auto Analysis, locate one success or error string, follow its reference, and explain the deciding function in plain language.
Rename only the symbols you can justify, correct one signature or type, compare the key condition in Listing, and use Function Graph if the branch structure is unclear. Finish by writing a one-sentence conclusion plus the addresses that support it. Repeat on several small samples before adding automation through PyGhidra or moving to debugger sessions.
For official behavior and UI details, consult the Ghidra Decompiler help. Install the current verified release with the Ghidra installation guide, and keep older projects backed up before opening them in a newer release.
- 0-5 minutes: find a reliable string, import, symbol, or address anchor.
- 5-10 minutes: read inputs, calls, branch conditions, writes, and return value.
- 10-15 minutes: improve one name, signature, or data type with evidence.
- 15-20 minutes: verify the decisive path in Listing or Function Graph and record the conclusion.
Ghidra decompiler FAQ
Does Ghidra recover the original source code?
No. It produces C-like pseudocode from machine code and analysis facts. Original names, comments, types, and exact source structure are usually unavailable.
How do I open the Decompiler window in Ghidra?
Open a program in CodeBrowser, choose Window > Decompiler if the panel is hidden, and select a defined function in Listing or Symbol Tree.
Why does Ghidra show undefined8 or many casts?
Ghidra knows the storage size but lacks a reliable type, or the function signature is wrong. Check callers, registers, signedness, pointer depth, and repeated memory offsets before applying a type.
Can Ghidra decompile C++?
It can analyze native code produced from C++, but templates, classes, exceptions, inlining, optimization, and stripped symbols can make the recovered pseudocode less source-like.
Should I trust the Decompiler or Listing?
Use both. The Decompiler is faster for understanding intent; Listing is the address-level evidence used to confirm branches, calls, constants, memory access, and side effects.