
Does Ghidra have a debugger?
Yes. Ghidra has a Debugger framework that can launch or connect to a live target, record a trace, expose registers and memory, and let you move through execution with breakpoints and stepping. The Debugger is not a replacement for the Decompiler: the Decompiler interprets a program statically, while the Debugger lets you observe one execution state at a time.
For a first session, think of the workflow as three connected views. GDB or another supported target agent controls the running process, Ghidra records the changing state as a trace, and the static program gives that state names, functions, and context. The most useful conclusions come from comparing all three instead of trusting one pane in isolation.
Only debug programs you own, have permission to inspect, or are explicitly allowed to use for training. Keep unknown files in an isolated virtual machine or disposable lab, and do not execute an untrusted sample on a workstation that contains personal credentials.
Prepare Ghidra, GDB, and a safe practice lab
The current site verification found Ghidra 12.1.3 in the official NationalSecurityAgency/ghidra release on August 22, 2026. The release was published August 18, 2026 and still uses the 64-bit JDK 21 requirement recorded on the installation guide. If you are starting from a clean machine, install the official archive first and confirm that Ghidra launches before troubleshooting the Debugger.
The Debugger examples below use a native target and GDB concepts. The exact launcher fields vary with the operating system and target agent, but the decision points are stable: select the correct architecture, keep the specimen path simple, record the command-line arguments, and know whether you are launching locally, attaching to an existing process, or connecting to a remote GDB server.
- Use a small executable with a predictable input and output.
- Keep the original file, a hash, and the Ghidra project in separate folders.
- Start with static analysis if the target is unfamiliar; dynamic execution is optional.
- Read the official Ghidra Debugger course when you need a target-agent-specific example.
| Need | Why it matters | Quick check |
|---|---|---|
| Ghidra 12.1.3 | Debugger and trace UI | Open Ghidra normally |
| JDK 21 64-bit | Runs the Java application | Check java -version |
| GDB or target agent | Controls the live process | Run gdb --version |
| Authorized specimen | Keeps the exercise legal | Use a lab binary |
| Symbols when available | Makes functions easier to read | Keep matching debug files |
Launch a first target with the Ghidra Debugger
Create a Non-Shared Project and import the practice executable so Ghidra can build the static program view. Then open the Debugger tool from the project environment. The goal of this first pass is not to recover perfect source code; it is to prove that the target launches, that the architecture is correct, and that the trace is receiving useful state.
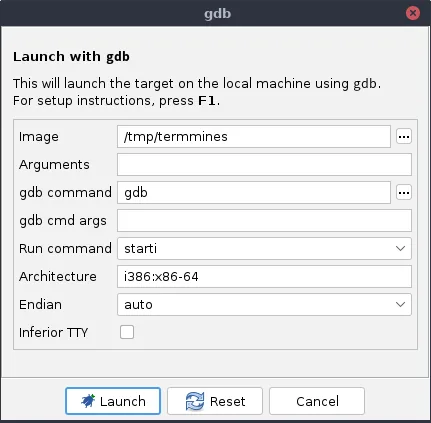
Choose the local GDB launcher and review every field before pressing Launch. The image is the target file, Arguments are the exact command-line values, gdb command selects the debugger executable, and Architecture plus Endian must agree with the specimen. If you are unsure, stop and verify the file format and processor instead of repeatedly launching a bad configuration.
- 1
Create the project
Open the project window, choose File > New Project, select Non-Shared Project, and store it in a disposable lab folder. Import the same file that you intend to launch.
- 2
Open Debugger
Start the Debugger tool and choose the launcher or target-agent action that matches your environment. Keep the static program open so you can compare it with the trace.
- 3
Review launcher fields
Set the image path, arguments, gdb command, architecture, endianness, and any inferior TTY or environment values. Avoid spaces and shell metacharacters in the first lab path.
- 4
Launch and pause
Launch the target, wait for the initial stop, and confirm that a thread, program counter, Listing, and Debug Console state are visible before stepping.
Attach to a process or connect to a remote target
Launching starts the target under the debugger. Attaching starts with a process that is already running, while a remote connection uses a target agent such as GDB server or a supported remote workflow. These modes are useful, but they add permissions, architecture, address-space, and network variables. Get one local launch working before moving to attach or remote debugging.
For an attach session, identify the process through an authorized lab workflow, select the matching debugger connector, and confirm the process architecture before continuing. For a remote target, verify the host, port, debugger-server version, symbol files, and trust boundary. A connection can succeed while the trace remains incomplete if the target agent cannot expose registers, memory, or module mappings.
Do not expose a debugger server to an untrusted network. Use a private lab network, authentication or a secure tunnel where appropriate, and clean up the listener when the exercise ends.
- 1
Choose the connection mode
Use Launch for a new local process, Attach for an existing local process, or a remote target workflow for a GDB server or another supported agent.
- 2
Match the target
Check processor, endianness, operating-system assumptions, and the address space. Load matching symbols when the target is stripped or optimized.
- 3
Validate the first stop
Inspect the thread, program counter, modules, and console output. If only a connection banner appears, treat the session as incomplete until state is populated.
Learn the Debugger workspace without getting lost
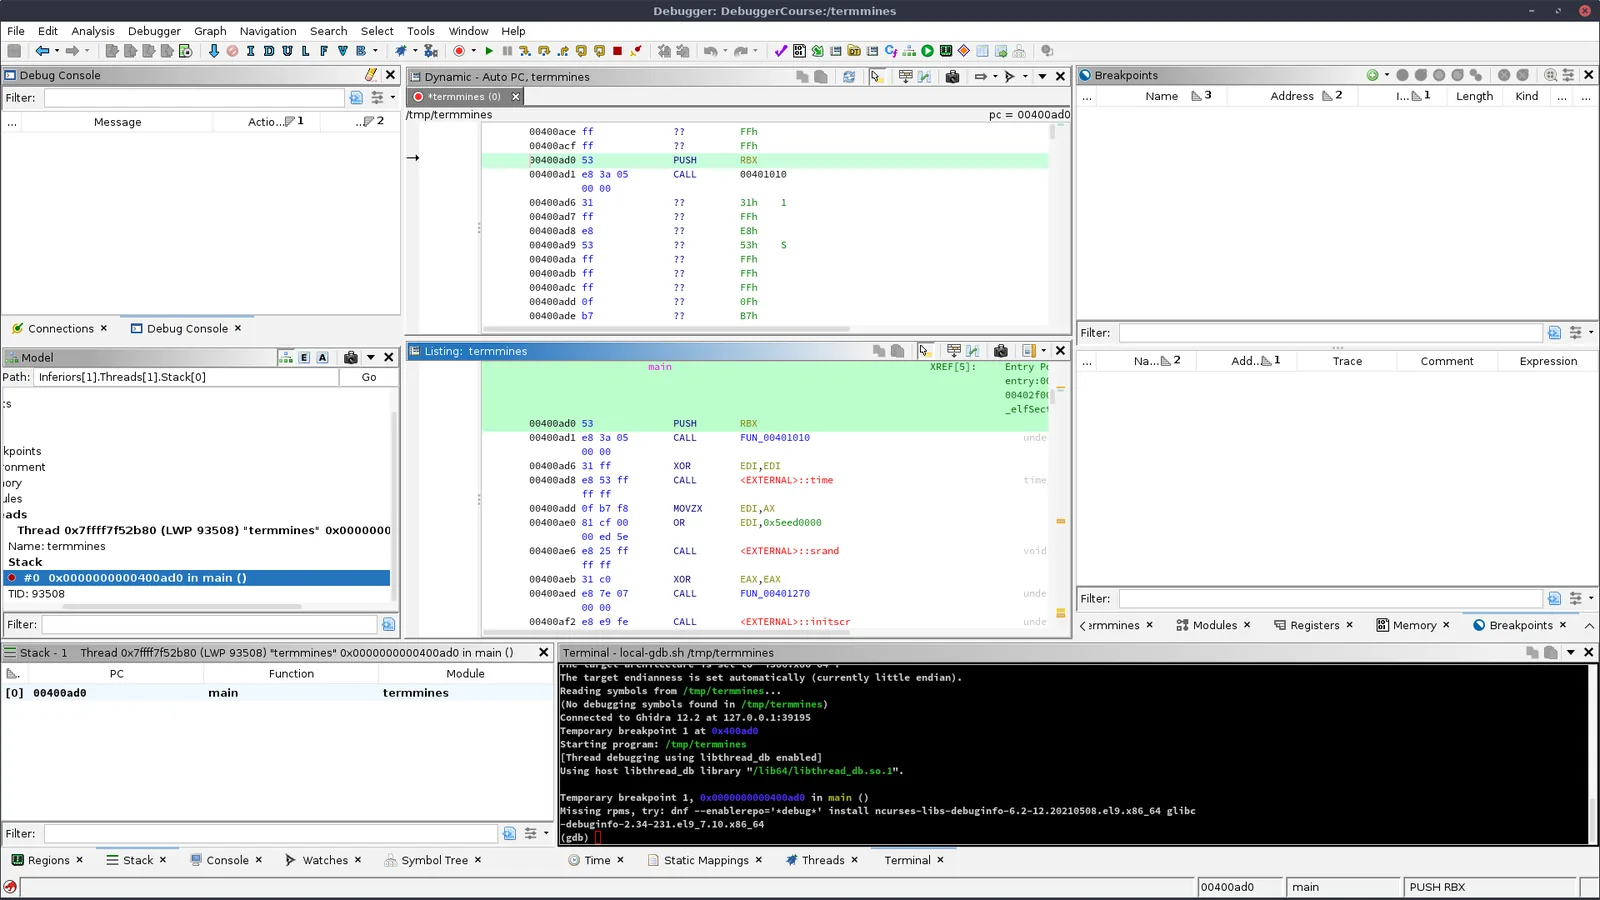
The Debugger workspace is dense because it shows several versions of the same execution state. Start with the program counter and the selected thread, then use the nearby panels to answer one question at a time. Do not open every view at once if the target is unfamiliar; a small repeatable loop is easier to diagnose.
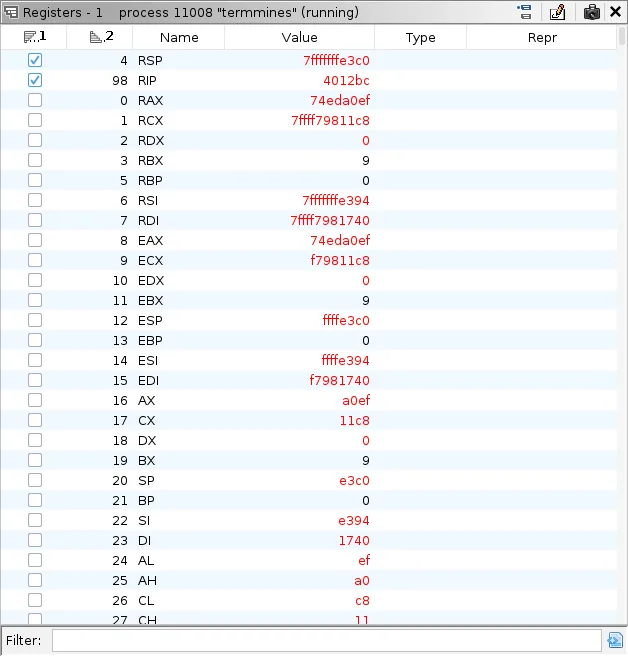
The Registers view is a state snapshot, not a high-level explanation. A changed register tells you what the target observed at one stop. Confirm why it changed by checking the instruction in Listing, the stack or memory around it, and the caller/callee relationship in the static program.
| Window | What it shows | First useful action |
|---|---|---|
| Debug Console | Target-agent messages and commands | Check launch or attach errors |
| Dynamic Listing | Instructions at the current trace state | Follow the program counter |
| Breakpoints | Active and effective stops | Confirm the breakpoint state |
| Registers | Register values and representations | Compare before and after a step |
| Threads / Stack | Execution paths and call frames | Select the interesting thread |
| Memory | Bytes and mapped regions | Inspect a referenced address |
Set breakpoints and step through code
A breakpoint is useful only when it stops at a location you can explain. Start with an entry point, a known function, or a branch connected to your practice input. After the stop, use Resume to continue, Interrupt to regain control, Step Into to enter a call, Step Over to keep the call at the current level, and Step Out to return to the caller. The exact toolbar icons can vary, so rely on the action name and the current thread state.
If a breakpoint is present but never becomes effective, check whether the target has reached the module, whether the address is mapped, whether permissions allow the stop, and whether the static-to-dynamic mapping is correct. A breakpoint on an optimized or inlined function may need a nearby instruction or a symbol-aware location instead.
- Set one breakpoint first; several pending breakpoints make the first session harder to read.
- Record the program counter, selected thread, and relevant register before stepping.
- After each meaningful stop, write down the input, branch, memory value, and conclusion.
- Remove or disable temporary breakpoints before handing the project to someone else.
Map live state back to CodeBrowser and the Decompiler
The Debugger becomes much more useful when the trace and the imported static program are mapped. Use the current address, module, function, and instruction bytes to locate the same code in CodeBrowser. Then read the Decompiler as a hypothesis: it can show the likely control flow and variables, but it is still an interpretation that should be checked against the Listing and the live state.
This is also where the debugger differs from a standalone GDB terminal. GDB can control execution, while Ghidra lets you keep the dynamic trace beside symbols, memory blocks, references, and decompiler context. If the mapping is wrong, stop and check the loaded module base, architecture, relocation, and imported program rather than forcing a misleading correspondence.
- 1
Locate the dynamic address
Use the program counter or a breakpoint location to identify the current module and address in the trace.
- 2
Find the static match
Open the corresponding program location in CodeBrowser and confirm bytes, function boundaries, and module mapping.
- 3
Explain the behavior
Compare Listing, Decompiler, registers, memory, and call stack. Record what is observed versus what is inferred.
Common Ghidra Debugger problems and better next steps
Most first-session failures are configuration mismatches rather than a missing Debugger feature. Make one change at a time and preserve the console output. A clean, small specimen is more useful than a complex target when you are proving the toolchain.
Do not treat a successful connection as proof that the session is ready. Confirm a populated thread, program counter, module map, and at least one readable state panel. If the target is stripped or optimized, expect to spend more time on symbols and address mapping.
| Symptom | Likely cause | Next step |
|---|---|---|
| GDB command not found | GDB is not installed or not on PATH | Use an absolute command path and verify gdb --version |
| No useful instructions | Wrong architecture or endianness | Recheck the file format and re-import the correct language |
| Breakpoint stays pending | Module or address is not mapped | Launch farther, inspect Modules, then set the stop again |
| Registers are empty | Target stopped before state was captured | Select the stopped thread and refresh the trace view |
| Symbols do not match | Stripped or mismatched debug files | Load matching symbols and verify the module base |
| Attach is denied | OS permission or isolation policy | Use an authorized lab process and adjust policy deliberately |
What to learn after the first debugging session
Repeat the same launch-and-stop loop on two or three small, authorized programs before attempting a remote target or a complicated multi-threaded sample. Practice explaining one branch from input, to breakpoint, to register or memory change, to the matching static function. That evidence trail is more valuable than collecting many screenshots or stepping without a question.
Use the Ghidra beginner tutorial for project creation, Auto Analysis, references, and Function Graph. Use the Decompiler guide when pseudocode needs better names and types, and return to the installation guide if JDK or launcher behavior is the real problem. The official Debugger course remains the best source for target-agent-specific details.
Ghidra Debugger FAQ
Does Ghidra have a debugger?
Yes. Ghidra includes a Debugger framework for launching or connecting to a target, recording traces, inspecting state, setting breakpoints, and stepping through execution. It complements rather than replaces the static CodeBrowser and Decompiler.
How do I attach the Ghidra Debugger to a process?
Start the Debugger tool, choose an attach or supported target-agent workflow, select the authorized process, and verify its architecture and initial state. Confirm that a thread, program counter, modules, and registers populate before stepping.
Do I need GDB to use the Ghidra Debugger?
The exact requirement depends on the target agent and workflow. The beginner path in this guide uses GDB because it is a common local and remote target interface. Other supported agents may have different prerequisites and configuration fields.
Is the Ghidra Debugger the same as the Decompiler?
No. The Decompiler interprets imported program bytes statically. The Debugger observes a live execution state such as the current instruction, registers, memory, threads, and stack. Mapping the trace to the static program lets you use both together.
Which Ghidra version was checked for this guide?
The official latest-release endpoint checked on August 22, 2026 reported Ghidra 12.1.3, published August 18, 2026. The site did not find a newer official release during that check; verify the official release page again before relying on version-specific behavior.