
What the Ghidra function graph shows
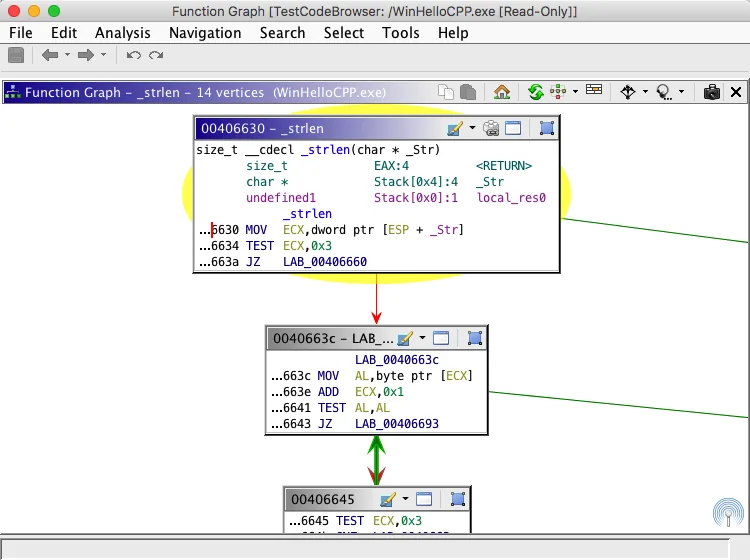
The Ghidra function graph displays the code blocks in the function under the cursor and the control-flow edges between them. A block is a straight-line region; an edge is a possible fall-through, branch, jump, or loop back.
This view is different from the Function Call Graph. Function Graph stays inside one function, while a call graph shows relationships between functions. Use the graph to ask where execution can go next, not to prove a value's meaning or universal reachability.
The graph is a control-flow view generated from the current program model. If the function boundary, disassembly, processor language, or analysis state is wrong, the graph can be incomplete. Confirm important paths in Listing, bytes, references, and the Decompiler.
Open the Ghidra Function Graph from CodeBrowser
Start with a small authorized sample and a recognizable function. The graph follows the function under the cursor, so opening it too early can produce an undefined view. Menu names can vary after tool customization, but the action belongs to CodeBrowser.
Select an instruction in Listing and choose Window > Function Graph. The Toggle Listing and Function Graph action is commonly bound to Ctrl-Space. A large function may take a moment to calculate.
- 1
Choose a function
Click an instruction in Listing or a named function in Symbol Tree. Prefer a short function with a visible conditional branch.
Listing -> instruction inside target function - 2
Open the graph
Use Window > Function Graph in CodeBrowser, or focus the existing docked provider.
Window -> Function Graph - 3
Fit the whole function
Zoom until the entry and exits are visible; use Satellite View for a large graph.
Graph view -> fit or zoom - 4
Record the context
Note the function name, address, language, and analysis state before edits.
function_name @ address
Read blocks, edges, exits, and loops
Read a graph from the entry block toward the exits. Each vertex contains a slice of Listing instructions, while arrows show the possible next blocks. A conditional branch usually has two outgoing edges; a loop has an edge that returns to an earlier block. An edge color or shape can help you scan the view, but the target address and Listing instructions are the authoritative details.
When a graph looks confusing, name the question before rearranging it. Are you looking for an error path, a loop condition, a switch case, or the block that calls another function? Highlight one path at a time and move back to Listing whenever a visual connection is ambiguous.
| Graph item | What it usually means | What to verify |
|---|---|---|
| Entry block | The first block of the current function | Function address and prologue |
| Vertex or block | Straight-line instructions with one entry region | Instructions and fall-through address in Listing |
| Conditional edges | Different paths after a branch or comparison | Condition, target addresses, and flags |
| Back edge | A possible loop or repeated path | Loop condition and exit block |
| Exit block | A return, tail transfer, or unresolved end | Return instruction, thunk, or missing boundary |
Navigate and arrange a crowded graph
A graph layout is a reading aid, not a new analysis result. Zoom out for the shape, zoom in for a branch, and drag a block when edges hide the route. Use Satellite View to jump around a large function.
Use the toolbar and context menu for layout and navigation actions exposed by your release. The official documentation covers Primary View, Satellite View, block actions, and the Listing toggle. Check action bindings instead of trusting an old shortcut.
- Fit the graph before deciding that a block is missing; it may be outside the current viewport.
- Move one block at a time and re-check the arrow target after every layout change.
- Keep the entry and exit blocks visible when explaining a path to another analyst.
- Use Ctrl-Space or the configured toggle to compare the same location in Listing and Function Graph.
- For a switch with many edges, follow one case and record its target address before exploring the next case.
Trace one branch from the graph to the Decompiler
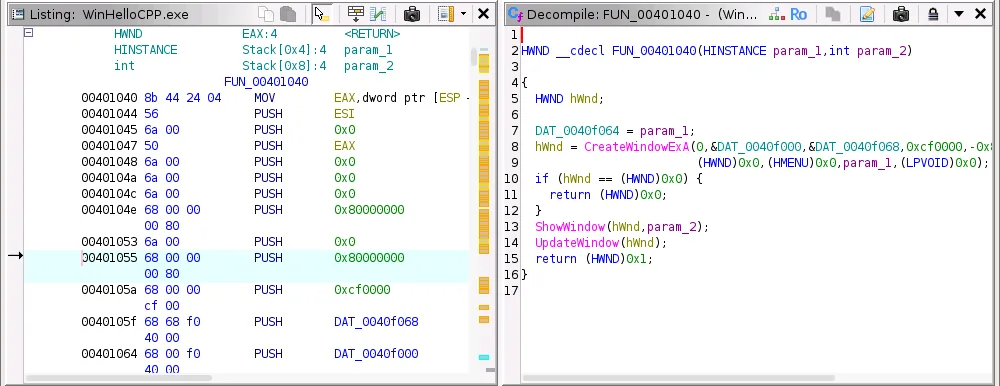
A useful first exercise is to trace one conditional branch. Start at the entry block, find the comparison, follow both edges, and record their destination addresses and conditions. Use references and the Decompiler to check the interpretation against instructions.
Aim for one reproducible observation, such as zero reaching an error block and nonzero reaching success. Keep the address and a note of the selected graph path because labels can change after analysis.
- 1
Mark the decision
Select the conditional jump or switch block and read its operands in Listing.
compare -> conditional transfer - 2
Follow both targets
Click each edge and note its first instruction; a target may be an error path, loop, or shared cleanup block.
target_a, target_b - 3
Check references
Use cross-references to see which callers reach the function and whether a target is shared.
References -> Show References To - 4
Compare pseudocode
Open the Decompiler for the same function. If it hides a cast or indirect jump, return to Listing and bytes.
Function Graph <-> Decompiler <-> Listing
Fix an undefined or misleading function graph
An empty or gray graph can indicate an undefined function, incomplete boundary, wrong processor language, or unfinished analysis. Confirm the address and bytes in Listing. Create or adjust a function only when surrounding instructions support that boundary.
After a change, let analysis finish and reopen the graph. Compare the entry address, block count, and exits with your earlier note. Record what changed so a new graph is not mistaken for a newly discovered fact.
Dragging blocks changes presentation only. It does not create a branch, fix a missing function, or prove that an indirect jump is reachable. Repair the program model in Listing, then reopen the graph.
Why the Ghidra function graph looks wrong
Most Function Graph problems are context problems. The cursor may be in another function, the graph may be zoomed into one corner, or an indirect transfer may be unresolved. Check the function name and address before changing settings.
Use this table as a first pass. It separates visual symptoms from evidence problems and points to the view that can confirm the cause.
| Symptom | First check | Safer next step |
|---|---|---|
| Graph is blank or gray | Cursor, function boundary, language | Confirm bytes and create or repair the function on a copy |
| Only part of the graph is visible | Zoom, viewport, Satellite View | Fit the graph and locate the entry block |
| Edges cross everywhere | Layout and function size | Move blocks, follow one target, and record addresses |
| Pseudocode disagrees | Same function and analysis state | Compare Listing, references, bytes, and data types |
| Shortcut does nothing | Action binding and focused tool | Use the Window menu or configure the action in tool options |
Validate the graph without overclaiming
Use the graph to organize a control-flow question, then verify it at instruction level. Check branch conditions, target addresses, fall-through, references, and returns in Listing. Use the Decompiler as a readable hypothesis, not a replacement for bytes. Indirect jumps and data-as-code mistakes can make a map incomplete.
Record the release, language, function address, path followed, evidence views, and unresolved edges. This makes the result repeatable and reviewable.
Ghidra Function Graph FAQ
How do I open the Function Graph in Ghidra?
In CodeBrowser, place the cursor inside a function and choose Window > Function Graph. You can also use the configured Toggle Listing and Function Graph action, commonly Ctrl-Space.
What is the difference between Function Graph and Function Call Graph?
Function Graph shows blocks and control-flow edges inside one function. Function Call Graph shows callers and callees between functions. Use the first for branches and loops and the second for inter-function relationships.
What does a block represent in the Ghidra function graph?
A block is a straight-line region of instructions with a control-flow entry and exit. Read its exact instructions and addresses in Listing before assigning meaning to the block.
Why is my Ghidra Function Graph blank or gray?
Check that the cursor is inside a defined function, the processor language is correct, analysis has finished, and the view is fitted. An undefined function or incomplete boundary can produce an empty or gray graph.
Does moving a block change the program analysis?
No. Dragging or rearranging a block changes the visual layout only. To change a missing function or branch, repair the program model in Listing and reopen the graph.
Can the Function Graph prove that a branch is reachable?
It shows a modeled control-flow path, not runtime proof for every input. Check the branch condition, callers, indirect transfers, and runtime or test evidence before claiming reachability.